
By Dr. Thorsten Krol and Ivan Gonzalez Jimenez, Siemens Energy
A decarbonization pathway in the steel industry involves using hydrogen in DRI. Several projects have been announced, with some already transitioning to green steel, awaiting the establishment of a hydrogen economy. A reliable green power system is essential for producing the required hydrogen. This article develops energy systems based on intermittent renewable sources, mainly wind and photovoltaic (PV) generators, to deliver a constant hydrogen flow into the DRI process. It discusses electrolyzer operations within various energy systems, using weather data from three countries over one year and integrating battery energy storage systems (BESS). All systems are sized to produce the hydrogen needed for a 1 Mt DRI plant.
The energy system
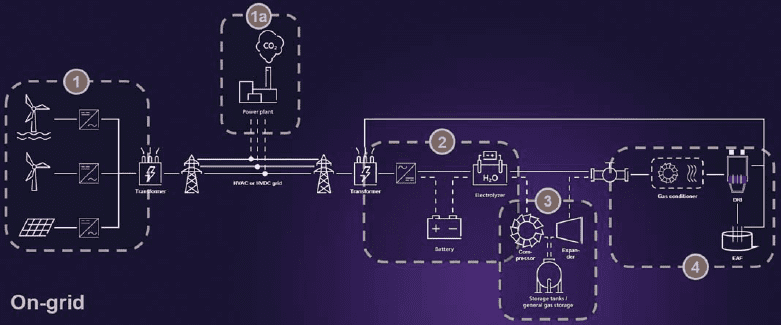
To produce green steel, green hydrogen is required using renewable energy sources (RES; see 1 in Figure 1). Due to limited hydropower in many countries, onshore wind or photovoltaic (PV) systems will be evaluated to operate the electrolyzers.
If connected to the grid, the power from thermal generators (1a) could also be used for hydrogen production to close the availability gap in RES generation. In this case, appropriate green power certification is necessary, limiting green hydrogen production.
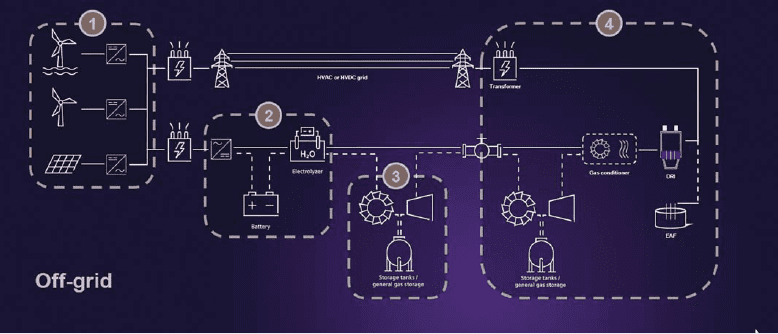
Off-grid projects require electrolyzer technologies with high operational flexibility to utilize intermittent renewable power. Integrating BESS (2) into the energy system – from green power generation to the DRI furnace – is essential to optimize capital and operational expenditures and reduce the price per kilogram of hydrogen produced. Hydrogen must be delivered to the DRI site and conditioned to the required temperature and pressure levels (4).
For off-grid projects, all power must come from RES, considering the demand of arc furnaces and other steel plant equipment (4) or other off -grid operations. The sizing of BESS or other systems (2) must account for this demand, prioritizing operations during power shortages. Hydrogen storage (3) during excess RES periods may be necessary to ensure this prioritized operation.
The system must reliably produce and deliver the required hydrogen over several years. To achieve this, the above-mentioned energy system’s building blocks can be considered independently or as one integrated system to find the best operational and financial configuration. The following section will discuss the boundary conditions and options.
The energy system for green hydrogen production
Hölling et al.(1) calculated the hydrogen requirement for hot briquetted iron (HBI) production using the direct reduction process based on the production at ArcelorMittal’s Hamburg plant. With an annual production of 1 Mt HBI and a specific hydrogen demand of 528 Nm³/t HBI, plus a purging rate of 10%, a demand of 635 Nm³/t HBI is needed. These values are confirmed by other authors.²,³ This study uses the value of 635 Nm³/t HBI, resulting in an annual hydrogen demand of 53,404 t H2 for a 1 Mt DRI process plant – or about 6.1 t H2/h. To keep the reduction process efficient, this level of hydrogen must be supplied continuously over the years.
According to M. El-Shafie (4), modern electrolyzers can produce hydrogen at up to 19 kg H2/MWh. Considering a 1% annual degradation rate, an average constant production rate of 18 kg H2/MWh over 10 years is assumed for both baseload and cyclic operation. This requires electrolyzers with a capacity of about 338 MW and a power purchase agreement (PPA) of at least 2.967 TWh for hydrogen production. To meet the steel industry’s decarbonization targets, the power demand should be generated with as high a share of renewable energy as possible.
As stated above, the main challenge for a reliable green hydrogen supply arises when intermittent RES like wind and PV are used. To evaluate green hydrogen production, different boundary conditions based on hourly generation profiles in various countries are considered. These profiles – sourced from renewables.ninja (5) and based on 2019 weather data – are analyzed throughout the whole year (see details in Table 1). For onshore wind, the hub height has been adjusted according to assumptions by the National Renewable Energy Laboratory (NREL) of the U.S. Department of Energy, to align with their published installation costs.
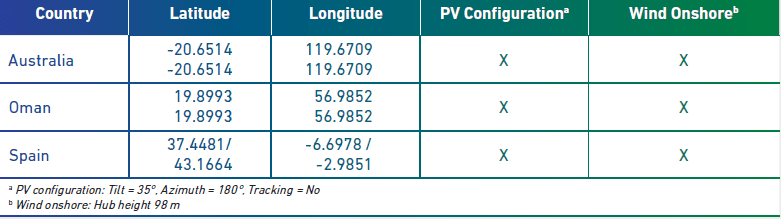
The RES profiles for Spain and Oman assume grid connection, allowing the use of non-RES power. In a second stage, a BESS is added to further reduce the carbon footprint of hydrogen production – up to producing it completely green.
Australian profiles are assumed to be off-grid, prioritizing power for a 24/7 mining operation as the primary consumer. Remaining RES generation can be used for hydrogen production, either for export to the steel industry off shore (for the 1 Mt DRI plant) or for producing green pig iron locally.
The energy system was optimized for the lowest investment costs, with accuracies of ±50 MW for RES generation, ±10 MW for electrolyzer installation, and BESS ratings of 200 MW, 400 MW, 600 MW, and 800 MW – with capacities of 2 h, 4 h, 6 h, or 8 h. Costs were normalized to publicly available data from NREL for wind, solar, and BESS (6), and extrapolated to 2030 according to the moderate scenario. Hydrogen electrolyzer costs were based on data from the European Hydrogen Observatory,7 valid for utility-scale installations, with adjustments for local price corrections and taxes.

As BESS costs decrease significantly with increasing capacity, these variations were considered. Other long-duration storage systems – such as compressed air energy storage or redox flow batteries – should also be evaluated based on project location. The prices used in this study are defined in Table 2. Given calculation accuracies and the current currency exchange rate, the conversion from USD to EUR is assumed to be unity.
Results and discussion
The RES power generation profile was evaluated hourly, with an average hydrogen production calculated at 18±1 kg H2/MWh, assuming 360 MW of electrolyzer capacity. The sensitivity study results for Spain are shown in Figure 2. The hydrogen demand of 53,404 t H2 is indicated by the red line (2,3,4). Bold lines represent green hydrogen production and hydrogen from other power sources. The diagrams on the right show annual RES generation curves for 500 MW, 1,000 MW, and 1,500 MW, with green lines for RES, purple for electrolysis based on green power, and grey for hydrogen from other sources. Hydrogen production is based on hourly RES generation for the three cases during the week of 25–31 January 2019.
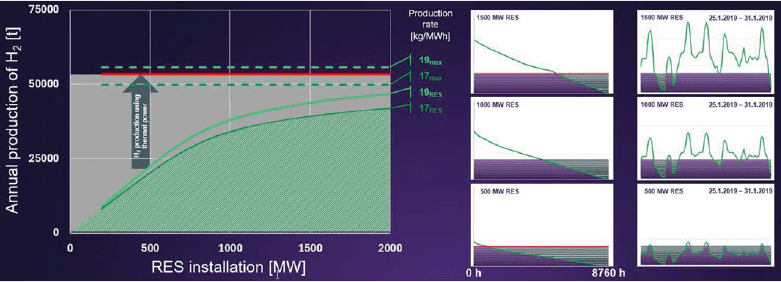
With 500 MW of RES, the green hydrogen share is 37.6% (17 kg H2/MWh) or 42.1% (18 kg H2/MWh). For 1,000 MW, it is 63.5% or 71.0%, and for 1,500MW, it is 73.2% or 81.8%. The remaining hydrogen must be produced from non-RES power or within the steel plant using natural gas.
The full decarbonization of the DRI process requires green power. During periods of low RES generation or excess RES generation, overproduction of green hydrogen is needed to cover times when RES generation is insufficient. Appropriate storage systems – for electricity or hydrogen – must be added, depending on local conditions, supply security, and system efficiencies and losses. Hydrogen storage costs vary by pressure and technology, so a BESS is used as the most comparable storage system. Calculations compare different RES generation profiles for a constant annual production of 53,404 ± 500 t H2.
Green hydrogen production with minimum capital expenditures is listed in Table 3, considering the different energy systems. Spain and Oman cases are on-grid, with the possibility to receive power from the grid with a carbon footprint. Regions that require green power to be produced regionally and simultaneously can produce hydrogen with high electrolyzer installations when power is available or by installing BESS or other long-duration storage facilities to shift green power according to demand. Modern electrolyzers operate within 40–100% of rated power without major negative impacts on lifetime to limit power storage installations.
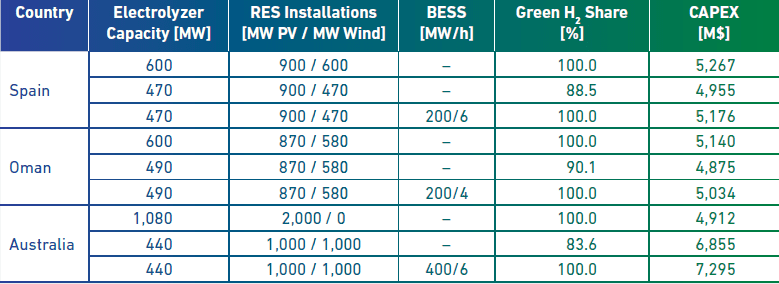
To produce green hydrogen for Spain and Oman, a RES generation mix of 60 ± 10% with 1,500 MW and 1,450 MW, respectively, resulted in the lowest capital expenditures. Both cases require 600 MW of electrolyzer capacity. Maintaining an annual production of 53,404 t H2, adding a 200 MW BESS with a 6-hour capacity can reduce wind generation and electrolyzer installations by 130 MW each – saving 1.7% on the entire energy system and 5.9% on initial investment. For Oman, a 400 MW BESS with a 4-hour capacity reduces electrolyzer installations by 110 MW, saving 2.1% overall and 5.1% short-term.
Figure 3 shows electrolyzer utilization. Each data point represents two electrolyzers with 20 MW of capacity. Some operate nearly at baseload with over 8,000 hours and fewer than 50 stops. Most operate cyclically, with fewer than 6,000 hours and over 200 stops annually, due to the high PV share (see green curves, Figure 3 left & center). Installing a BESS increases operating hours beyond 6,000 and reduces stops by over 31% in Spain and 16% in Oman – resulting in more than 20 hours per stop. Larger BESS could enable full baseload operation but would require a high additional investment of $1,570 million for Spain and $1,087 million for Oman, plus extra RES installations (210 MW PV and 160 MW wind for Oman). This would allow electrolyzers to operate over 1,000 hours per stop in Spain and over 2,000 hours per stop in Oman.
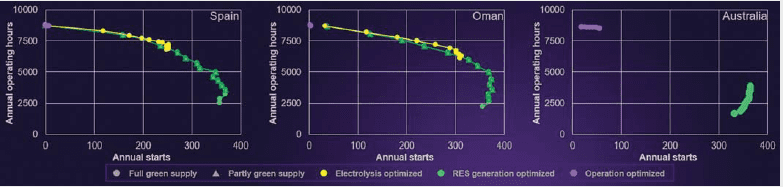
For Australia’s off -grid energy system, the priority is the reliable operation of a mine with an annual peak demand of 168 MW. Excess power can be used for hydrogen production. If hydrogen production exceeds 53,404 t H2, a steel plant with 1Mt DRI annual capacity can be considered, or hydrogen can be exported. The analysis suggests a 2 GW RES installation with less than 50% PV and over 560 MW of electrolyzer capacity to meet the hydrogen requirements. The cheapest solution is a 2 GW PV-only installation, but it cannot continuously power the mining operation, which would then have to rely on thermal generators overnight. Electrolyzers would operate 3,900–1,650 hours, with 365–332 stops, resulting in 10.7–5.0 operating hours per stop (Figure 3 right, green profiles).
Technically, a better system would include 1,000 MW PV and 1,000 MW wind with a 400 MW BESS (6-hour capacity), charging during high RES generation and discharging during low RES generation. This setup allows electrolyzers to operate at baseload with over 8,400 hours and fewer than 60 stops, resulting in 146–433 operating hours per stop. Although this requires about 50% higher investment, it supports green mining operations. However, the BESS would still result in 100 hours of nonavailability of the mining operation annually. Closing this gap requires an additional investment of over $2,900 million or using excess green hydrogen for thermal generation in backup units – which would necessitate a redesign with higher investments across all components.
Conclusion
Green hydrogen supply for the direct reduction process is crucial for decarbonizing the steel industry. Various energy systems capable of producing more than 53,000 t H2 – sufficient for a 1 Mt DRI plant – have been discussed. Comparing renewable generation profiles from Spain, Oman, and Australia shows a high dependency on the PV and wind mix. Both on-grid and off -grid projects require 1.5–2 GW of RES installations to power 440–1,050 MW of electrolyzer capacity for green hydrogen supply. Adding a large-scale BESS (200 MW+ rating, 4 h+ capacity) can reduce the required RES and electrolyzer capacity, improve electrolyzer utilization, and shift from cyclic to baseload operation – lowering overall energy system costs. Future long-duration energy storage systems could further reduce costs and enhance hydrogen production and supply security.
References
1 Hölling, M., & Gellert, S. (2018). Direct reduction: Transition from natural gas to hydrogen? Proceedings of the 8th International Congress on Science and Technology of Ironmaking (ICSTI 2018), Vienna, Austria.
2 Journal of Cleaner Production, 203 (2018), 736–745.
3 Steel Research International, 91(11) (2020), 2000110.
4 Results in Engineering, 20 (2023), 101426.
5 Renewables.ninja. (2019). Dataset: Merra-2 (global).
6 National Renewable Energy Laboratory. (2024). Electricity technologies – Annual Technology Baseline (ATB).
7 European Hydrogen Observatory. (n.d.). Electrolyser cost.